


在雅思小作文数据类题目中,柱状图的信息量往往较多且杂。成为不少考生的头疼事。下面启德考培老师为大家带来雅思写作Task1柱状图范文:英国移民。
话题
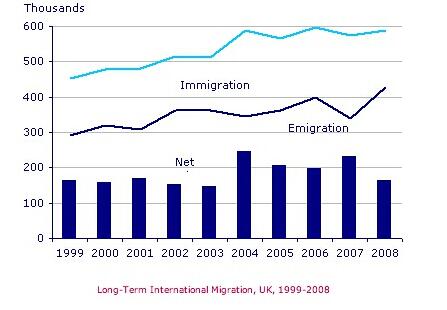
The chart below shows long-term international migration in UK.
范文
The chart gives information about UK immigration, emigration and net migration between 1999 and 2008.
Both immigration and emigration rates rose over the period shown, but the figures for immigration were significantly higher. Net migration peaked in 2004 and 2007.
In 1999, over 450,000 people came to live in the UK, while the number of people who emigrated stood at just under 300,000. The figure for net migration was around 160,000, and it remained at a similar level until 2003. From 1999 to 2004, the immigration rate rose by nearly 150,000 people, but there was a much smaller rise in emigration. Net migration peaked at almost 250,000 people in 2004.
After 2004, the rate of immigration remained high, but the number of people emigrating fluctuated. Emigration fell suddenly in 2007, before peaking at about 420,000 people in 2008. As a result, the net migration figure rose to around 240,000 in 2007, but fell back to around 160,000 in 2008.(159)
以上就是启德考培老师给大家分享雅思写作Task1柱状图范文:英国移民的相关内容,希望文章里的这些信息能够帮助到大家,如果还想了解其他方面的信息,请点击立即咨询联系我们。
考试热门工具预约
- 测启德在线学习系统,免费开放预约
- 练丰富题库免费预约试用
- 学0元免费预约公开课
- 评实地测试,老师测评,免费开放预约

雅思口语Part2话题卡怎么准备万能素材
2026/09/18 18:46:04

雅思考试前一周怎么冲刺复习
2026/09/18 18:45:55

雅思G类和A类成绩哪个认可度高
2026/09/18 18:45:47

雅思成绩什么时候提交申请最合适
2026/09/18 18:45:38

雅思口语Part1常见问题及回答思路
2026/09/18 18:45:30

托福成绩可以替代雅思申请英国大学吗
2026/09/18 18:45:21